The Porsche 911 Has the Same Drunk Driving Rate as a Camaro. It Kills 5x Fewer People.
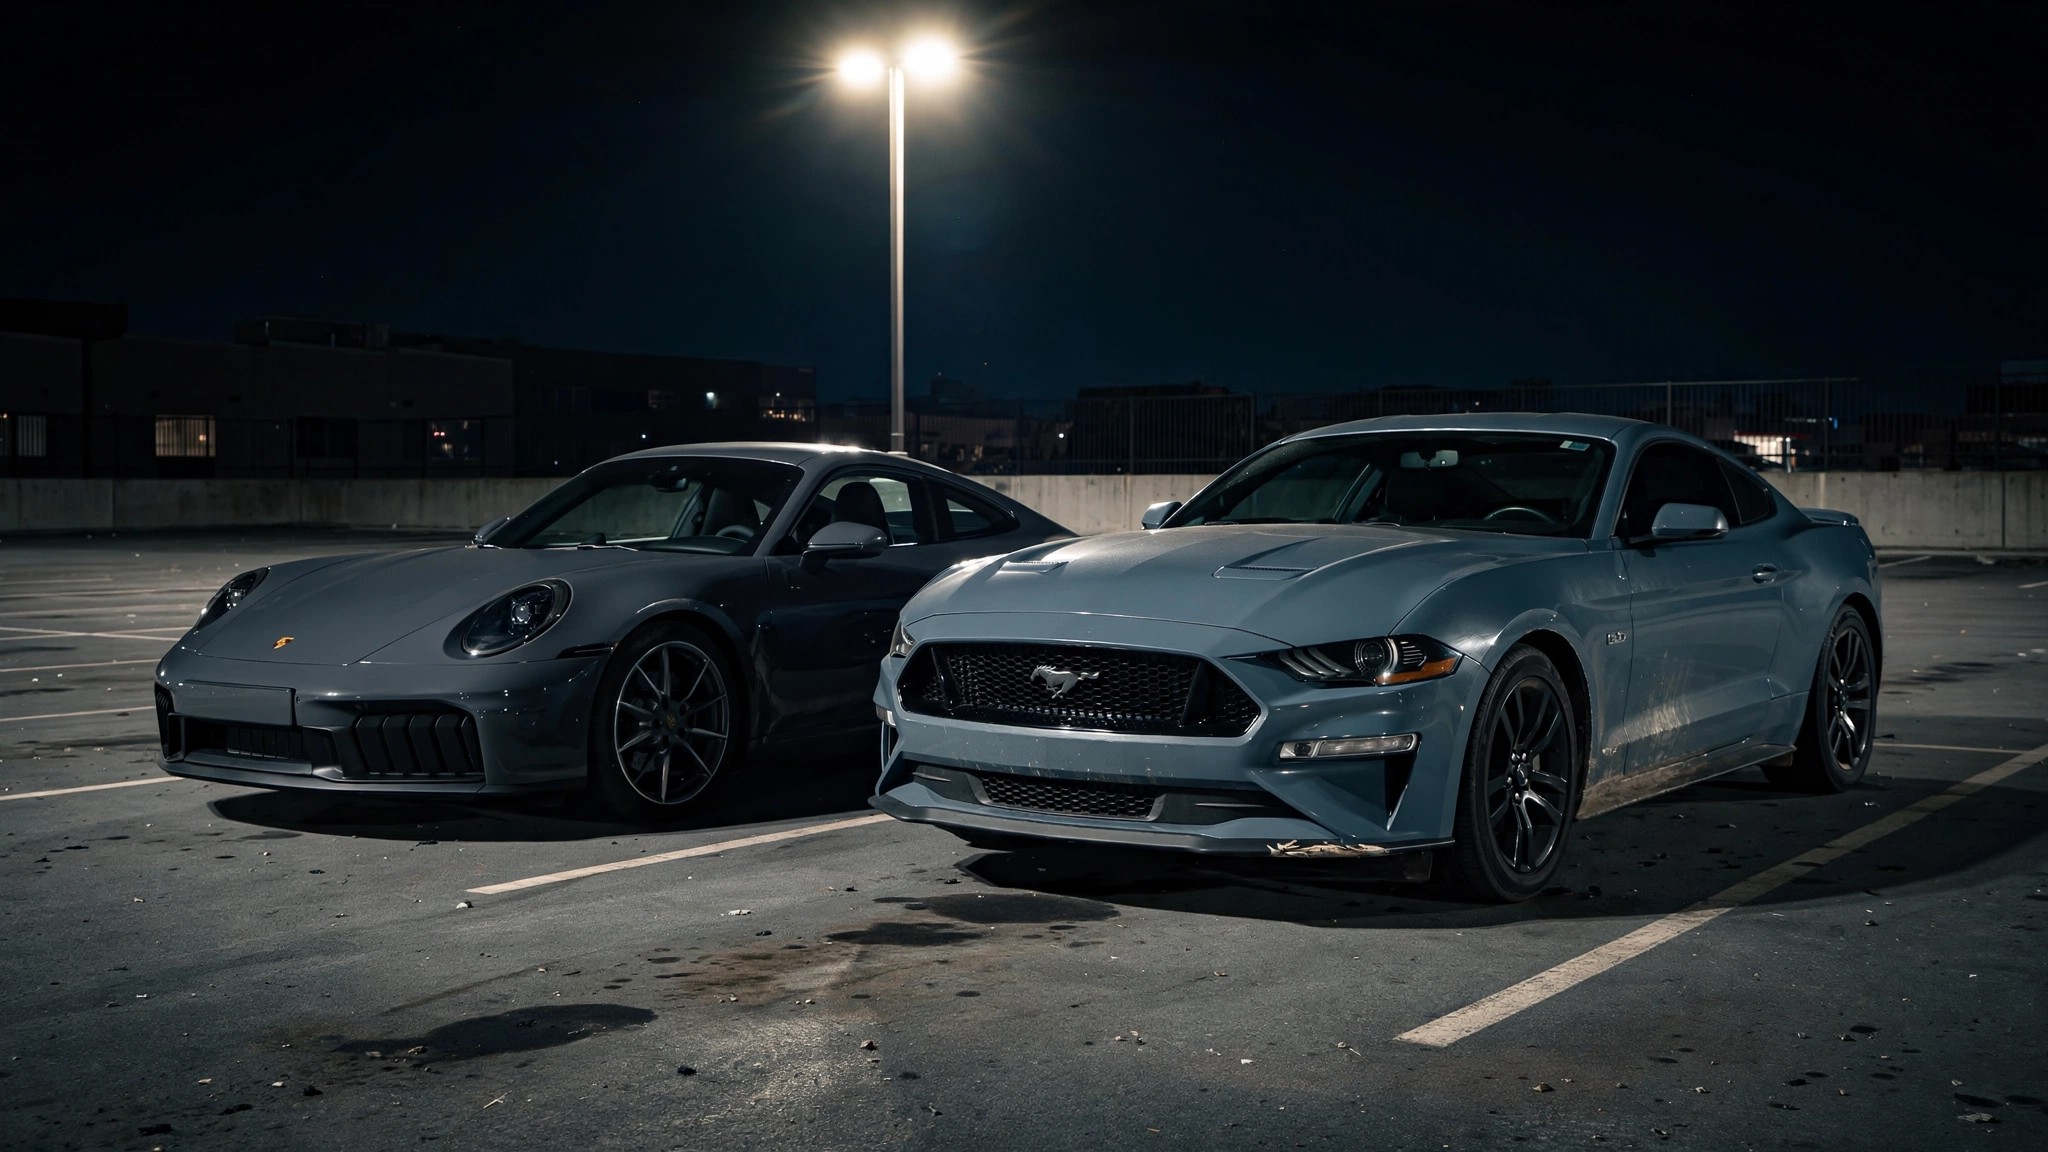
According to the toxicology reports, 22.8% of Porsche 911 drivers in fatal crashes test positive for alcohol or drugs. Not a typo. Nearly one in four. Chevrolet Camaro? 23.0%. Dodge Challenger? 22.5%. Ford Mustang? 21.9%.[1]
Same impairment rates. Same class. Same problem. Completely different body counts.
A 911 kills at 0.69 per 100 million vehicle miles traveled. Camaro: 3.44. Mustang: 6.02. Same drunk-driving problem, five to nine times fewer deaths. And here's what stings: the Mustang actually has lower impairment than the 911. Its sober drivers die at a rate that the 911's drunk ones can't match.
You'd assume the 911's safety advantage comes from survivability. Porsche engineering, crumple zones, German over-engineering, all that. Except the data says the opposite. When a 911 is involved in a fatal crash, its occupant dies 84.2% of the time. For a Mustang, that number is 69.6%. Camaro: 62.7%. Challenger: 52.2%. Among sports cars, the 911 is the least survivable in a fatal crash.[1]
Which means the 911 isn't saving people inside the crash. It's preventing the crash from happening. Rear-engine balance refined over six decades, available all-wheel drive, massive brakes that can haul two tons from 60 in under 100 feet, and stability management calibrated at the Nürburgring. When a 911 driver is three drinks deep and misjudges a corner, the car corrects before physics becomes fatal. A Mustang, with its rear-wheel-drive power delivery and crowd-departing oversteer reputation, gives the impaired driver exactly the car they shouldn't have.
Corvettes make this argument even sharper. Highest impairment rate of any sports car at 26.2%, and worst per-crash lethality at 0.884. One in four Corvette drivers in fatal crashes is impaired. When they crash, almost no one walks away. Yet the Corvette's death rate is 1.52, still 4x lower than a Mustang. Mid-engine balance and a wider contact patch absorb the owner's worst decisions at a rate the pony car can't approach.[1]
There is an uncomfortable demographic objection. Porsche buyers are older, wealthier, and probably drive on different roads at different times than a 22-year-old financing a base Mustang EcoBoost at 17% APR. Fair. But compare the 911 to a Corvette: similar buyers, similar price points, similar road behavior. Stuttgart still wins by 2.2x. At some point, the car deserves credit.
What this means for you
Don't drink and drive. That's always the answer. But if you're shopping for a sports car and you care about surviving your own worst night: the engineering that separates a 0.69 from a 6.02 death rate isn't brochure marketing. It's 48 funerals versus 2,739. Check the FARS rate before you sign. And check your VIN at nhtsa.gov/recalls regardless.
Limitations
Small-sample warning: the 911's FARS dataset contains 48 deaths and 171 drivers tested. Statistical noise is real at this volume. Fleet estimates carry ±15% uncertainty for low-volume models. FARS captures only fatal crashes, so the 911's rate advantage could shrink or vanish in non-fatal crash data. And the deaths-per-crash metric doesn't distinguish between a 911 occupant dying versus someone in another car. Numbers this thin describe patterns, not certainties.
Sources & References
- NHTSA, Fatality Analysis Reporting System (FARS), 2014–2023. 337 models, 171 Porsche 911 driver toxicology records, 4,664 Ford Mustang driver records. nhtsa.gov
- NHTSA, FARS Query Tool (CDAN). Cross-tabulation of impairment status by make/model for fatal crash-involved drivers. cdan.dot.gov
- IIHS, Fatality Statistics: Fatality Facts 2023. Vehicle class definitions and fatality trends by vehicle type. iihs.org